Praxis Insights: Making the Invisible, Visible – upon request
| |

Praxis Insights: Making the Invisible, Visible – upon request

Reason Praxis Insights: your go-to practice to track end-to-end Business Strategy delivery Blog initially published on 21st April 2021. Updated on 29 March 2022 and on 4 Sept 2022  Praxis Insights offers organisations and businesses the opportunity to make Insights, Analytics and Reporting reliable, or fix it for good. In a blog published initially in…

How to evaluate a business outcome’s performance?
| | | |

How to evaluate a business outcome’s performance?

Illustration with mathematics teaching policies in the US and Japan. When analysing data or information, whether quantitative or qualitative and even policies, history matters. Indeed, history shows us the evolution and direction taken by events, which we can then appreciate against given quality assessment criteria. To those who believe that “good” and “bad” criteria don’t…

Is leaving the EU leaving the EEA?
| | | |

Is leaving the EU leaving the EEA?

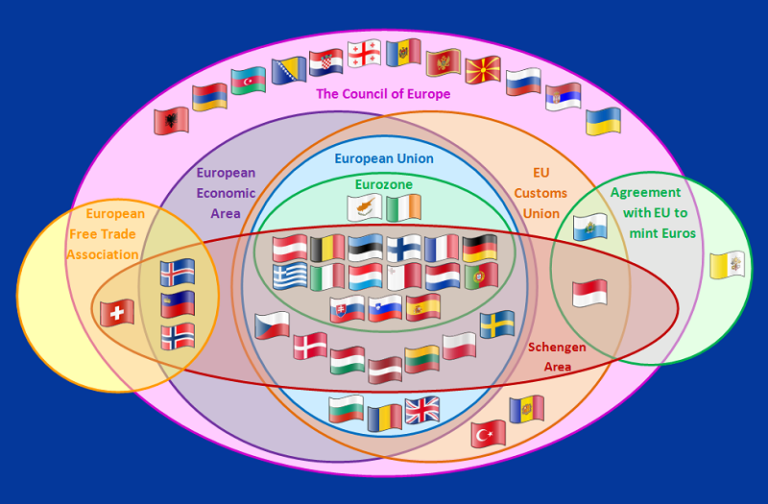
This article is a continuation of the last “How to visualise supranational bodies the UK belongs to?”, as it answers now the question raised at the end of it: “Is leaving the EU leaving the EEA?”. Our analysis is that by leaving the EU, in a no-deal scenario, the UK would get back to existing…

How to visualise supranational bodies the UK belongs to?
| | | |

How to visualise supranational bodies the UK belongs to?

Illustration with the EULER diagram The UK is part of thousands of international treaties or bodies, most known being the Commonwealth, the UN, the EU, the EEA and the Council of Europe. If we limit our purpose to the continent and specific supranational bodies the UK and other continental countries belong to, the EULER diagram…

Lots of information circulates on global warming and man’s role in it
| | | | |

Lots of information circulates on global warming and man’s role in it

A few facts to help and think about. At reason, we know that looking at facts is the beginning of the understanding of a topic, and an issue if it is seen as such. The Global Carbon Atlas is a good place to start when looking at facts about CO2 emissions. The below map shows the 2017 world’s…